Archives
Archive for June, 2014
June 12, 2014
“Agile Development” and the Digital Humanities
Since returning from my second DHSI, I’ve had a little time to reflect on my experience and to bask in the glory of my new—but still fledgling—programming skills. Like Chris, Emily, James, and Mathieu, I spent last week happily enrolled in Josh and Zailig Pollock’s course on “A Collaborative Approach to XSLT.” And, like my classmates, I was encouraged to embrace aspects of what the instructors referred to as an “Agile development method” (in essence, an iterative and adaptive approach to coding and project management). As we worked through exercises to reinforce each of the day’s lessons, we learned to test and tweak our code obsessively, and in this small way we began to see how an “agile” approach to DH projects might prove valuable on a larger scale.
For the benefit of those who haven’t read it, the “Manifesto for Agile Software Development” reads as follows:
We are uncovering better ways of developing
software by doing it and helping others do it.
Through this work we have come to value:Individuals and interactions over processes and tools
Working software over comprehensive documentation
Customer collaboration over contract negotiation
Responding to change over following a planThat is, while there is value in the items on
the right, we value the items on the left more.
(Source: agilemanifesto.org; emphasis added)
As one can see, the agile method offers a number of practical, even common-sense suggestions that can be usefully incorporated into most collaborative DH projects. In terms of my own DH work—and I’m thinking specifically here of my role in getting the Canadian Modernist Magazines Project up and running—an agile workflow or development approach will likely benefit the project in several ways. For example, I hope to successfully model the agile method’s emphasis on openness (to collaboration, to changing tools and conditions in the digital landscape, or even to the overall direction of the project). Perhaps even more importantly, however, I want to avoid being paralyzed by obsessive over-planning or inflexible long-term projections; instead, I want to work incrementally, letting each small step or misstep guide the next. The reality is that any new DH project is the product of innumerable blunders and misgivings, just as any “polished” essay is (in my experience) the product of multiple drafts and, initially, ill-conceived thoughts or malformed sentences.
Finally, I think it’s important for institutions that wish to support DH projects to recognize, and perhaps to help mitigate in some small way, the institutional pressures that confront English literary critics qua DH scholars in their work as DH scholars. But I guess what I really mean to advocate is an understanding of the similarities between literary critics and programmers or DHers, not the differences that make collaboration between them a potentially overwhelming undertaking. As those of us who have been lucky enough to participate in DHSI are well aware, the literary critic and the technogeek no longer occupy mutually exclusive domains. While I acknowledge the dangers of getting entirely immersed in the DH world and thus neglecting to hone one’s unique skills as a literary critic, I also acknowledge the need to constantly re-think my own research in light of rapidly changing disciplines, departmental practices, and institutional exigencies. So thank you for the education, Josh and Zailig—and thank you, EMiC, for another great week at DHSI.
June 12, 2014
Augmented Reality and Education
For DHSI 2014, I had the pleasure of being a part of the Augmented Reality class with Markus Wust. In this class, we were introduced to using the technology of Layar to build a mobile application. One of the most interesting potentials of building a mobile applications that Markus introduced to the class was that of “serendipitous learning”. The idea behind this kind of learning is to build applications that would allow for learning to happen spontaneously as users navigate through their environments. For example, someone could be walking home from work and suddenly get an alert on their phone that they are close to a historical landmark. They could then bring up the application and discover a part of history that they didn’t realize existed before then. One of my favourite augment reality applications that allows for “serendipituous learning” is that of the Museum of London. I believe that being able to overlay the past with the present allows us to look at our world in a new way and to have a better appreciation for our history. Using augmented reality gives us with this appreciation.
June 12, 2014
What Makes It Work
As part of EMiC at DHSI 2014, I took part in the Geographical Information Systems (GIS) course with Ian Gregory. The course was tutorial-based, with a set of progressive practical exercises that took the class through the creation of static map documents through plotting historical data and georeferencing archival maps into the visualization and exploration of information from literary texts and less concrete datasets.
I have been working with a range of material relating to Canadian radical manifestos, pamphlets, and periodicals as I try to reconstruct patterns of publication, circulation, and exchange. Recently, I have been looking at paratextual networks (connections shown in advertisements, subscription lists, newsagent stamps, or notices for allied organizations, for example) while trying to connect these to real-world locations and human occupation. For this course, I brought a small body of material relating to the 1932 Edmonton Hunger March: (1) an archival map of the City of Edmonton, 1933 (with great thanks to Mo Engel and the Pipelines project, as well as Virginia Pow, the Map Librarian at the University of Alberta, who very generously tracked down this document and scanned it on my behalf); (2) organizational details relating to the Canadian Labor Defense League, taken from a 1933 pamphlet, “The Alberta Hunger-March and the Trial of the Victims of Brownlee’s Police Terror”, including unique stamps and marks observed in five different copies held at various archives and library collections; (3) relief data, including locations of rooming houses and meals taken by single unemployed men, from the City Commissoner’s fonds at the City of Edmonton Archives; and (4) addresses and locational data for all booksellers, newspapers, and newsstands in Edmonton circa 1932-33, taken from the 1932 and 1933 Henderson’s Directories (held at the Provincial Archives of Alberta, as well as digitized in the Peel’s Prairie Provinces Collection).
Through the course of the week I was able to do the following:
1. Format my (address, linguistic) data into usable coordinate points.
2. Develop a working knowledge of the ArcGIS software program, which is available to me at the University of Alberta.
3. Plot map layers to distinguish organizations, meeting places, booksellers, and newspapers.
4. Georeference my archival map to bring it into line with real-world coordinates.
5. Layer my data over the map to create a flat document (useful as a handout or presentation image).
6. Export my map and all layers into Google Earth, where I can visualize the historical data on top of present-day Edmonton, as well as display and manipulate my map layers. (Unfortunately, the processed map is not as sharp as the original scan.)
7. Determine the next stages for adding relief data, surveillance data, and broadening these layers out beyond Edmonton.
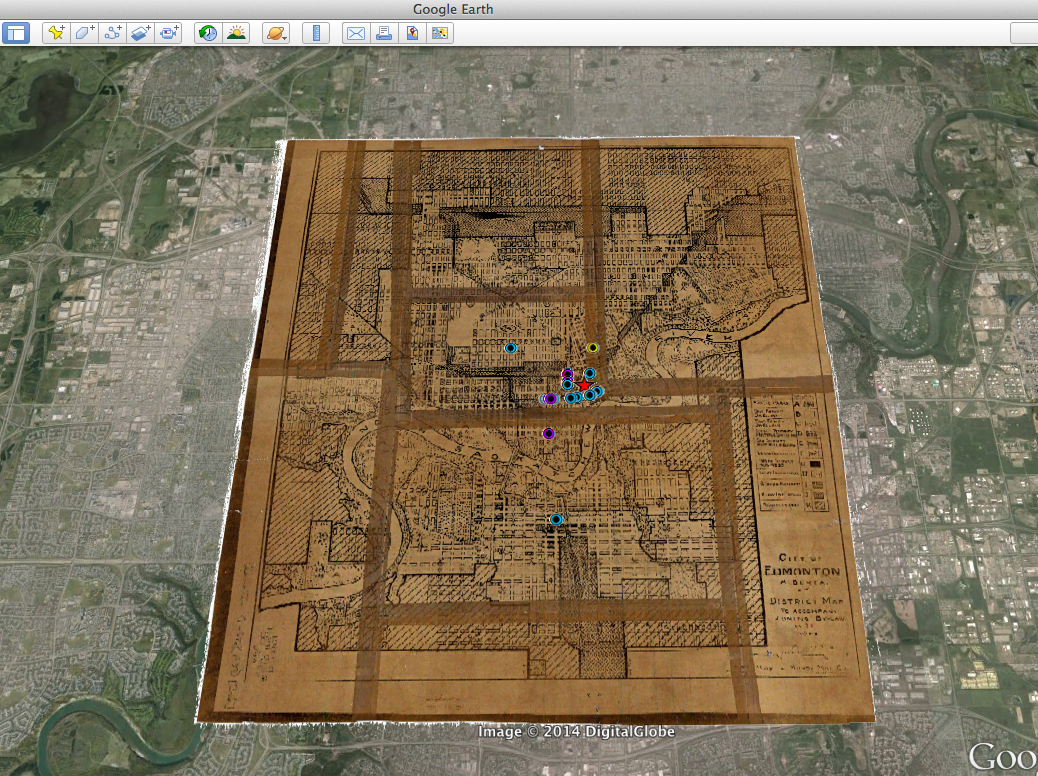
Archival map of City of Edmonton, 1933, georeferenced and overlaid into Google Earth imagery
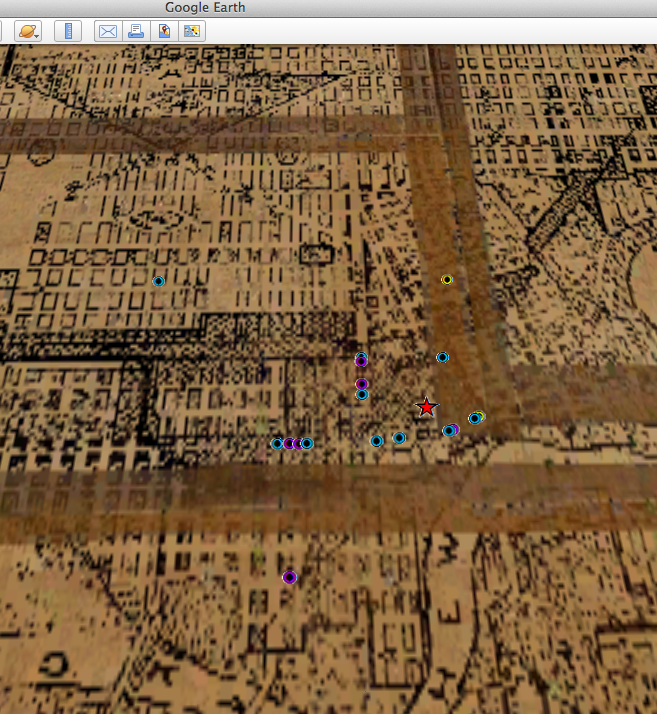
Detail: Archival map of City of Edmonton, 1933. Downtown area showing CLDL (red), booksellers (purple), newsstands (blue), and meeting places (yellow)
What I mean to say is, it worked. IT WORKED! For the first time in five years, I came to DHSI with an idea and some data, learned the right skills well enough to put the idea into action, and to complete something immediately usable and still extensible.
This affords an excellent opportunity for reflecting on this process, as well as the work of many other DH projects. What makes it work? I have a few ideas:
1. Expectations. Previous courses, experiments, and failures have begun to give me a sense of the kind of data that is usable and the kind of outcomes that are possible in a short time. A small set of data, with a small outcome – a test, a proof, a starting place – seems to be most easily handled in the five short days of DHSI, and is a good practice for beginning larger projects.
2. Previous skills. Last year, I took Harvey Quamen’s excellent Databases course, which gave me a working knowledge of tables, queries, and overall data organization, which helped to make sense of the way GIS tools operated. Data-mining and visualization would be very useful for the GIS course as well.
3. Preparation. I came with a map in a high-resolution TIFF format, as well as a few tables of data pulled from the archive sources I listed above. I did the groundwork ahead of time; there is no time in a DHSI intensive to be fiddling with address look-ups or author attributions. Equally, good DH work is built on a deep foundation of research scholarship, pulling together information from many traditional methods and sources, then generating new questions and possibilities that plunge us back into the material. Good sources, and close knowledge of the material permit more complex and interesting questions.
4. Projections. Looking ahead to what you want to do next, or what more you want to add helps to stymie the frustration that can come with DH work, while also connecting your project to work in other areas, and adding momentum to those working on new tools and new approaches. “What do you want to do?” is always in tension with “What can you do now?” – but “now” is always a moving target.
5. Collaboration. I am wholly indebted to the work of other scholars, researchers (published and not), librarians, archivists, staff, students, and community members who have helped me to gather even the small set of data used here, and who have been asking the great questions and offering the great readings that I want to explore. The work I have detailed here is one throughline of the work always being done by many, many people. You do not work alone, you should not work alone, and if you are not acknowledging those who work with you, your scholarship is unsustainable and unethical.
While I continue to work through this project, and to hook it into other areas of research and collaboration, these are the points that I try to apply both to my research practices and politics. How will we continue to work with each other, and what makes it work best?
June 12, 2014
DHSI Word Cloud: The future is collaborative
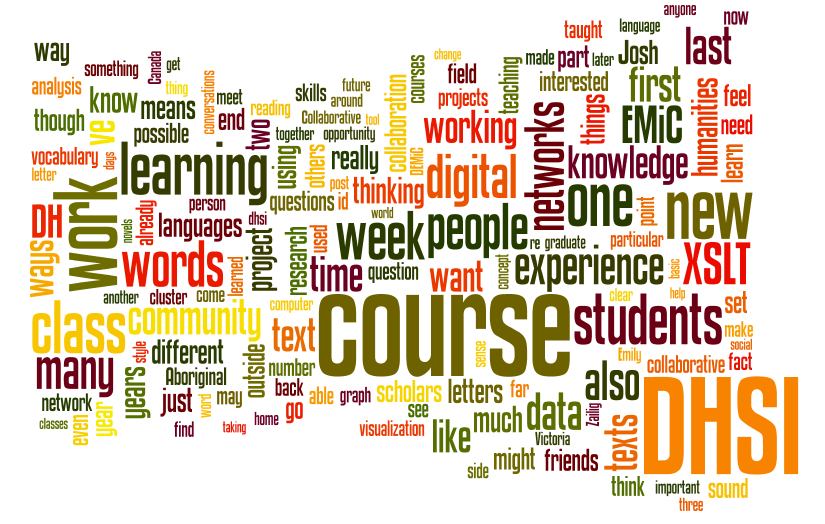
This word cloud was created by submitting all of the EMiC blog posts about DHSI 2014 to a program that generates a visualization of the most commonly used words and phrases. Words that encourage working together, such as “community,” “cluster,” “collaborative,” “together,” and “social,” are a prominent theme in the cloud, with “Future Around Collaborative” acting as a fitting subtitle to the central words “Learning Course DHSI.” I also enjoy how the cloud arrangement created the term “Working Digital People.” Hopefully DHSI 2014 left everyone feeling like well-oiled working digital (humanities) people. The blog certainly indicates that everyone is feeling better equipped to create and motivated to co-create with others. Please keep sharing– the blog activity has been excellent these past ten days and the posts are encouraging and stimulating. Thanks to everyone for keeping the conversation going!
June 11, 2014
Encouraging Undergrad Involvement in DH
I would like to pick up on the idea of bringing the sense of community and excitement of DHSI back to the undergraduate students at my home institution. I feel that this is especially important now that DEMiC has had its last DHSI. I occasionally encounter some troubling attitudes towards undergraduate students in the “upper levels” of academia. Yes, they are young and may not be considering their future in the field at this point. Yes, many do not take their undergraduate work seriously. Yes, not all of them will be thinking about continuing on to graduate studies and beyond. Things change. Many students do not benefit early on from a sense of inclusion in a community of scholars, which may stem from traditional notions of undergraduates as consumers of, but not producers of, knowledge. When I was an undergrad I did not consider applying to grad school (or getting involved in the digital side of humanities work) until I met an incredibly supportive professor in the final year of my degree. I was taking her CanLit course as a requirement, had no previous experience with the field, and had never heard of anything called the Digital Humanities. And now I’m hooked.
Since I am a TA and not in the position to incorporate DH skills and theory into my tutorials, I am left wondering how best to encourage “my” undergrad students to get involved. I briefly described DHSI to my classes before leaving for Victoria last week. I let them know that since our library is a sponsor, the tuition is greatly reduced for anyone interested in attending in the future. I encouraged those interested in becoming English majors or who have computer-based skills to send me an email or come talk to me during office-hours about future opportunities in the field. I don’t claim to have all the answers; but I do have access to a community of scholars who might!
Of course, I wouldn’t want to push the discipline on students who are not interested in the digital side of English studies or who have no immediate plans to pursue a graduate degree. Basically, I put the bug in their ears. Maybe only one of my students will actually be interested in DH; maybe none of them will be. But I would like to pay the favour forward by providing opportunities for young scholars to get involved in this highly energetic and collaborative discipline, in whatever ways that I can.
June 10, 2014
Island Intersections
This was my first time to DHSI as well as Victoria. The experience was incredible. I feel so fortunate to have spent a week learning and collaborating with so many brilliant people. I took the ‘Sounds of the Digital Humanities’ course last week. Along with learning practical skills in Audacity and Garage Band, we learned some basic sound theory and engaged in many in-depth discussions about a variety of sound related subjects including ethics and sound history.
I learned about the importance of listening. This seems like a simple epiphany, I know, but I think using your ears can be overlooked in today’s society that is so full of visual stimuli. This was an important lesson to be reminded of.
I learned about sound collage and even made my own. Now every sound I hear I can’t help but think about in terms of where it might fit into a sound collage, and question if it is a real sound or just a sound effect.
It seems to me that Digital Humanities is about the intersection of something very old and something relatively new. The fact that such a large conference has grown out of DH is a testament to just how adaptable the humanities are. I find this comforting, and I think comfort in academia is sometimes a rare commodity, and one that when found must be cherished and appreciated. It comforts me meeting so many great people who have forged a life in the academic realm. It comforts me to know that although the world is constantly in flux–as is academics–that if the humanities can find there way from parchment to PDF, maybe I can embrace the constant change and find my way in a world I have always dreamed of being a part of.
June 10, 2014
Community Formation – DEMiC 2014
Now that I am home unwinding from what was such an incredible and busy week, I can finally speak about my experience at this year’s DEMiC. This was my first time at DHSI, but it was not my first course through EMiC. Last summer I attended TEMiC in Kelowna where I had the opportunity to learn about different theoretical approaches to editorial work. The course was very useful to orient the beginnings of my editorial project, and for this reason I was eager to attend DEMiC. Although it differed from the course I did last summer, it did not disappoint. I had the opportunity to gain valuable hands-on experience with computer coding by working closely with fellow EMiC students and teachers Zaillig and Josh Pollock in the “A Collaborative Approach to XSLT” course. Following the completion of a challenging but useful week of training, I now come away with a strong foundation in XSLT that will be invaluable to the future of my editorial project, and feel as though I am part of a strong and close community.
Last week’s course promoted exactly what its name proposes: a collaborative approach to XSLT working through the interests of computer coding and literary scholarship. While the course demanded a lot of hard work, it was very well organized which enabled a manageable workload. Josh helped students learn the fundamentals of XSLT, and Zaillig provided his own feedback on the challenges he faced while working with this type of coding on his P.K. Page digital project. In addition, both Pollocks worked together to give insight into multiple possible ways of incorporating XSLT into digital editorial projects and also emphasized the importance of working in teams to generate new ideas. Although I was intimidated at first by the course due to my lack of familiarity with XSLT, both teachers were very patient and open to questions, and for this reason they created a very comfortable learning atmosphere. I was also able to consult other students in the class for guidance, as they were willing to help me work through any kinks I faced throughout the course. It was evident that the sense of collaboration that Zaillig and Josh tried to foster was not limited to their charismatic relationship, but also extended to their interaction with the class and the interaction they encouraged between the students. Albeit I will have to continue working diligently on becoming more comfortable with this new coding language; however, I feel as though the Pollock team has left me with the necessary tools to do so. I would recommend the course to anybody interested in doing digital editorial work, and/or interested in exploring new coding languages in a comfortable and productive learning environment.
Not only was the course a great collaborative learning experience, but I also enjoyed the opportunity to meet many EMiCers outside of class, and catching up with people I met at last year’s TEMiC. I come away from this experience not only feeling more comfortable with the concept of creating a digital project, but also as though I am part of a close community that is very supportive of its members. While I am sad that this was the last time DEMiC will happen, I am happy to have met so many interesting individuals, and to have learned from them. The course has only heightened my excitement for TEMiC next month where I will have the opportunity to gain more theoretical knowledge on sound archiving, and where I will be rejoining my fellow EMiC friends. For those who will be at TEMiC next month, see you soon! For the others, I look forward to crossing paths with you sometime soon!
June 9, 2014
Updated: Goodbye, DHSI
DHSI 2014 is done, and most EMiCites will be heading home tonight or early tomorrow. Many have captured their experience of DHSI—some in Victoria for the first time, others for the last—on the EMiC blog. If you were were too busy XSLTing or doing yoga on the lawn of the cluster housing to keep up, now’s your chance: a roundup of DSHI 2014 blog posts is below. The list will be updated as more posts are published.
![]()
Lee Skallerup Bessette acknowledges the overwhelm that is DSHI Day One: http://editingmodernism.ca/2014/06/dhsi2014-all-the-things-all-the-people/
Hannah McGregor talks network visualization and the role of DHSI in fostering EMiC and DH community: http://editingmodernism.ca/2014/06/thinking-with-networks/
Chris Doody reports back from Zailig and Josh Pollock’s new course in collaborative XSLT: http://editingmodernism.ca/2014/06/a-collaborative-approach-to-xslt-and-a-riddle/
Emily Ballantyne advocates for the the value of vocabulary, not just expertise: http://editingmodernism.ca/2014/06/the-art-of-conversation-learning-the-language-of-xslt/
James Neufeld reflects on the experience of one again being an apprentice: http://editingmodernism.ca/2014/06/lessons-learned-from-collaborative-xslt/
Marc Fortin creates beautiful visualizations of Aboriginal language networks: http://editingmodernism.ca/2014/06/visualizing-the-landscape-of-aboriginal-languages/
Kaarina Mikalson absorbs confidence from the community of DHSI, of EMiC, and of DH: http://editingmodernism.ca/2014/06/on-belonging/
Emily Ballantyne says goodbye to DHSI after 6 years: http://editingmodernism.ca/2014/06/saying-goodbye/
And so does Jeff Weingarten: http://editingmodernism.ca/2014/06/thoughts-on-the-last-dhsi/
Sarah Vela on her first DHSI, and the learning curve of DH: http://editingmodernism.ca/2014/06/dhsi-and-the-never-ending-learning-curve-of-the-digital-humanities/
Emily Robins Sharpe on the affective side of collaboration: http://editingmodernism.ca/2014/06/what-does-it-mean-to-collaborate/
Alana Fletcher demos out-of-the-box text analysis: http://editingmodernism.ca/2014/06/tool-tutorial-out-of-the-box-text-analysis/
Anouk Lang gives us eleven more reasons (on top of her original twenty-two) to go to DHSI: http://editingmodernism.ca/2014/06/thirty-three-ways-of-looking-at-a-dhsi-week/
June 8, 2014
Thirty-three ways of looking at a DHSI week
 In 2012, after a brilliant week of taking the GIS course at DHSI, I wrote a post with twenty-two reasons to go to DHSI. I did not think it was possible, but this week has been even better than that one, in part because I am now much further in to my work with digital methods, and my comfort levels are much higher. So, herewith a followup post, two years on, with eleven further reasons to convince anyone who hasn’t yet drunk the kool-aid, or to choose a more database-appropriate metaphor, taken the red pill.
1) First of all, the feeling of being stretched and challenged in entirely unpredictable ways: of being taken way outside of my comfort zone, having my object of study taken away from me, exploded into unrecognisable pieces, conceptually reassembled, and handed back to me. It’s a cliche that DH forces us think differently about what we do and how we do it, but the generative experience of actually doing this intensely for an entire week with experts in the room is an immense privilege, in a world where the imperatives to knock out REF-able publications, achieve “impact” with our research, climb ever higher on departmental and university rankings tables and so forth–these are our UK imperatives; there are others in the north American context–militate against the deep immersion that we need to do our best work.
2) I’m going to give the Databases course its own reason to go to DHSI. Yes, really. Databases. It sounds dismal. It’s anything but. Take this course if your research involves even a moderate amount of data-gathering (hint: if you are using Excel and find yourself adding extra columns, putting in lots of null values and becoming dissatisfied with the way your tables represent whatever it is you are studying, a relational database is probably what you want instead). Harvey is hilarious, and long impromptu riffs on an eclectic medley of pop culture texts turn into serious points about the theoretical and practical exigencies of working with relational databases. The pedagogical component of this course is top-notch: he has thought very hard about how to make the material intuitively graspable by people who are not trained as computer scientists. Come for the standup, stay for the profound transformations to your thinking.
3) Almost as good as databases is … free beer! A prize for accidentally walking up to the registration table at exactly three o’clock. I didn’t think I could be happier about arriving in Victoria under deep blue skies, reconnecting with EMiC friends and starting a week of databases, but turns out free beer will do the trick.
4) An antidote to years of finding the command line intimidating. Decades, in fact: our first family computer had an MS-DOS prompt into which my brother typed arcane magic words, and the helplessness I felt watching the screen fill up with glowy green type is a visceral memory. After a 45 minute unconference session with Jonathan Martin, it is intimidating no more, and in fact to my surprise somewhat intuitive. For those who want to try, the resource we used is called Learn Code the Hard Way.
5) The vault of collective knowledge that it is possible to tap into via the #dhsi2014 hashtag. Trying to quickly clean up a data set, I sent out a plaintive cry for help with a regex to remove URLs, and three lovely people answered in under a minute with suggestions. (Happy ending: I figured it out myself! Woohoo! It is the world’s ugliest regex, but it works.)
6) Twitter, which this year was something of a different experience. There was absolutely no chance of following the #dhsi2014 backchannel, given that new tweets popped up on it roughly every three and a half seconds, and in fact the TAGS spreadsheet keeping the twitter archive broke. So, because I couldn’t follow it completely, I dipped in and out. While I know I will have missed many things, I feel like I still got something of a decent sense of many of the most interesting conversations–the conversations about gender happening in #femdh, or Susan Brown’s wisdom about managing large and long-running projects in the #cwrcshop, for instance–which could then be followed up in meatspace by collaring friends who had been sitting in those classes. I do feel marginally less tapped out brain-wise than I have in previous years, so that’s a plus. DHSI is obviously not getting any smaller in the near future, so we’re all going to have to find other ways of filtering the backchannel.
7) Serendipity, which always happens at DHSI: it is like some kind of magic fairy dust that Ray arranges to have sprinkled around the campus. Discovering that the person standing behind me in the line at the Monday night reception was a topic modelling guru who graciously let me pull out my laptop so he could show me around a topic modelling tool with a nice GUI. Finding that Emily Robins-Sharpe also teaches transnational modernisms and swapping notes on texts we put on our syllabi. Giving a paper at the colloquium and getting tweets from people working on similar areas, and meeting afterwards to share resources.
8) Victoria and its serene beauty: the fir trees, the beach, deer grazing on the cluster lawn in the twilight, a faun trotting after its mother, a lone bunny hopping past a cluster house. #comebackbunnies
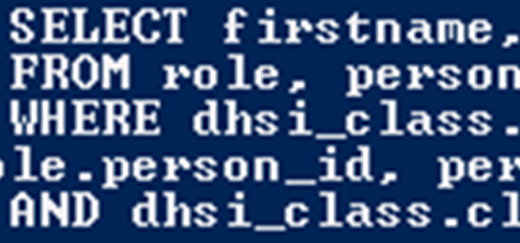
9) Meeting people, all the people, all the time. People who I have gotten to know virtually and whose work I have admired from afar – Scott Weingart, Paul Fyfe, Alex Gil – and whom it was a pleasure to finally meet in person and continue conversations that had already started online. People with whom there’s lots of common ground research-wise: Paul Barrett, for instance, who is doing some intriguing work on topic modelling the archive of Austin Clarke, and Alana Fletcher, who knows the Queen’s University archives like the back of her hand and who is, happily, willing to work on digitizing the Crawley materials. And of course picking up with everyone with whom the Atlantic ocean gets in the way of hanging out on an everyday basis: my excellent Twentieth-Century Literary Letters project collaborators; my fabulous housemates Hannah, Lee & Karis who have all three had wonderful professional successes since the last time we caught up, which make me happy to know them and to be associated with them through EMiC. Let me have a shot at doing this as a left join …
USE dhsiclubSELECT firstname, lastname, “, “, role_nameFROM role, person_role, person, dhsi_attendees, dhsi_classWHERE dhsi_class.class_id=dhsi_attendees.class_id, dhsi_attendees.person_id=person.person_id, person.person_id=person_role.person_id, person_role.role_id=role.role_idAND dhsi_class.class_year=2014
10) Developing my thinking about the letter as cultural artefact, and about the work of transmission that it performs. Thinking beyond its existence within document culture (see, Harvey, I’m learning) and reimagining it within database culture, its magical power to connect not just people but places, texts and ideas comes to the fore. And tabulating those elements in a database enables us to query them, ie. relate them, in ways that we cannot if we look at them within document culture.
11) Finally, if I had to pick one overriding quality of DHSI, it would be generosity. I’ve had the privilege of participating in DHSI over the past six years because Dean was generous (farsighted? foolish?) enough to invite me, as an early-career scholar, to be a co-applicant on EMiC. The ramifications of this act of generosity will continue to ripple out for a long time for me, and I have a difficult time articulating how important my involvement in EMiC has been, especially as I write this at the end of a week in which all the words have gone because all the brain is full. Along with Dean’s generosity, there’s the generosity of other Canadian faculty and graduate students who have been welcoming to an interloper with a peculiar interest in the literature of their country. (“Why would anyone outside Canada want to study Can lit?” is the question that emerges, politely, sooner or later in most conversations. The answer, for the record, is: because awesome.)
EMiC colleagues, from the most eminent senior scholars to just-beginning graduate students, I can’t tell you how much your friendship and your intellectual company means to me, at DHSI and the other occasions when I’m fortunate enough to hang out with you physically, virtually, or on the page. Thank you all, and may we continue to be left joined connected for many years to come.
June 8, 2014
Tool Tutorial: Out-of-the Box Text Analysis
This year at DHSI — my third and perhaps last round of it — I took Out-of-the-Box Text Analysis for the Digital Humanities, taught by NYU’s David Hoover. This class deepened my understanding of the way digital tools can enhance traditional ways of reading and analyzing texts. Using the Intelligent Archive Interface (a text repository developed at NYU and downloadable at http://www.newcastle.edu.au/research-and-innovation/centre/education-arts/cllc/intelligent-archive), as well as Minitab, Microsoft Excel (with a number of additional macros from Hoover), and some basic TEI, we explored largely comparative ways of answering questions about authorship attribution, textual and authorial style, and meaning, based largely on word frequency. The results of these analyses were visualized using dendrograms, cluster graphs, and loading/score plots.
Here’s a walk-through of one of the basic methods we learned of creating and visualizing a comparative analysis of the most frequently-used words in different texts.
First, open the Intelligent Archive. In our class, we used a version populated with a number of plain-text novels, short stories, and poems edited by David Hoover. Go to “Text Sets” and either select an existing set of texts to compare, or create a new set. To create a new set out of new texts, go to the “Texts” tab, “Add New,” browse for your file(s), and add them to the repository. Give your new text set a title and add your new texts to it using the left-pointing arrow. Here, texts from 19th-century authors Stephen Crane and Robert Barr are being compared under the text set title “Barr vs Crane 55 texts.”
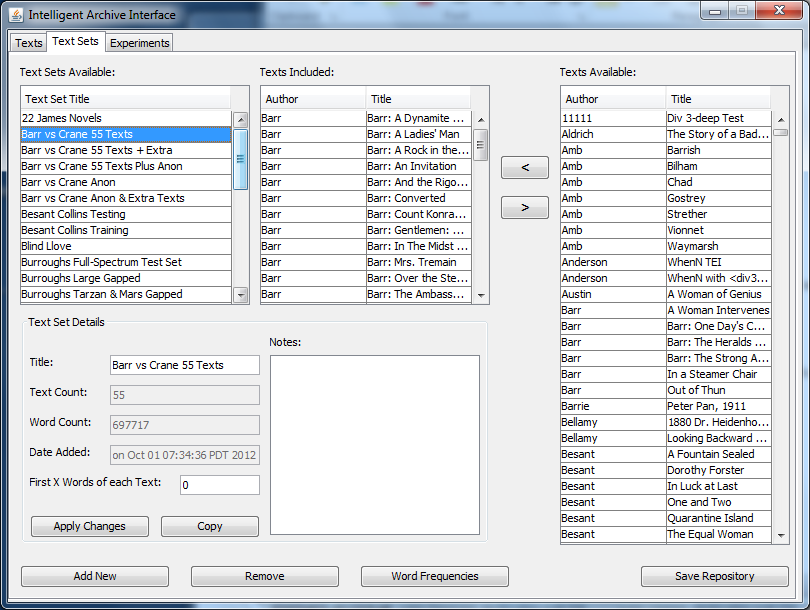
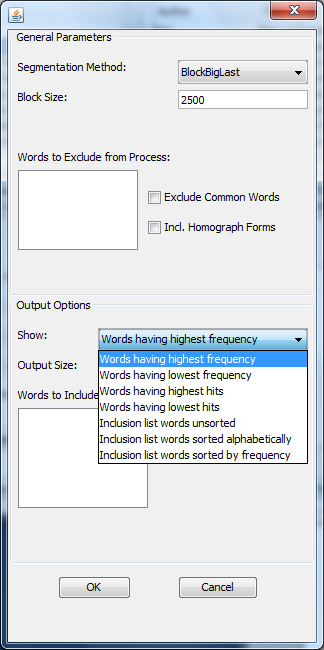
Once you have the text set ready for comparison, click on “Word Frequencies,” and choose the proper parameters for your comparison. Different selections provide slightly different results: the “BlockBigLast” selection divides the text into chunks and places any extra in one last large chunk. You can also select “Text Divisions” if you’ve marked divisions (ie. for chapters) in the plain text file you’re working on. Choosing “Text” will simply compare the entire texts against one another. “Words Having Highest Frequency” is the selection for charting the most frequently-used words across the indicated chunks of text. Other possible selections are “Inclusion words” selections (sorted or unsorted): entering particular topical keywords that you’d like to track in the “Words to Include in Process” box includes only these keywords in the analysis. The output size is the number of most frequent words (or least frequency words, or words with highest hits [that is, words occurring in most sections of the text, but not most frequently overall]) you’ll be using. 1000 is the highest word count that can be used in Minitab. Finally, select “WordTypes” to make sure you’re analyzing words.
Once you’ve made your parameter indications, click OK. This will generate a text segment list, which displays the number and proportion of times the most frequent words occur in same-size chunks of each text.
Change the output type to “Show Proportions” (this gives you the percentage occurrence of word frequencies). Select all the data with the “Select all” button, and then click on “Copy to Clipboard.” Next, paste the segment output into a plain Excel spreadsheet, transpose it so that the texts run down the side and the words across the top; and run a find and replace to change any apostrophes to carats (apostrophe seem to throw things off).

Copy this transposed spreadsheet into Minitab.

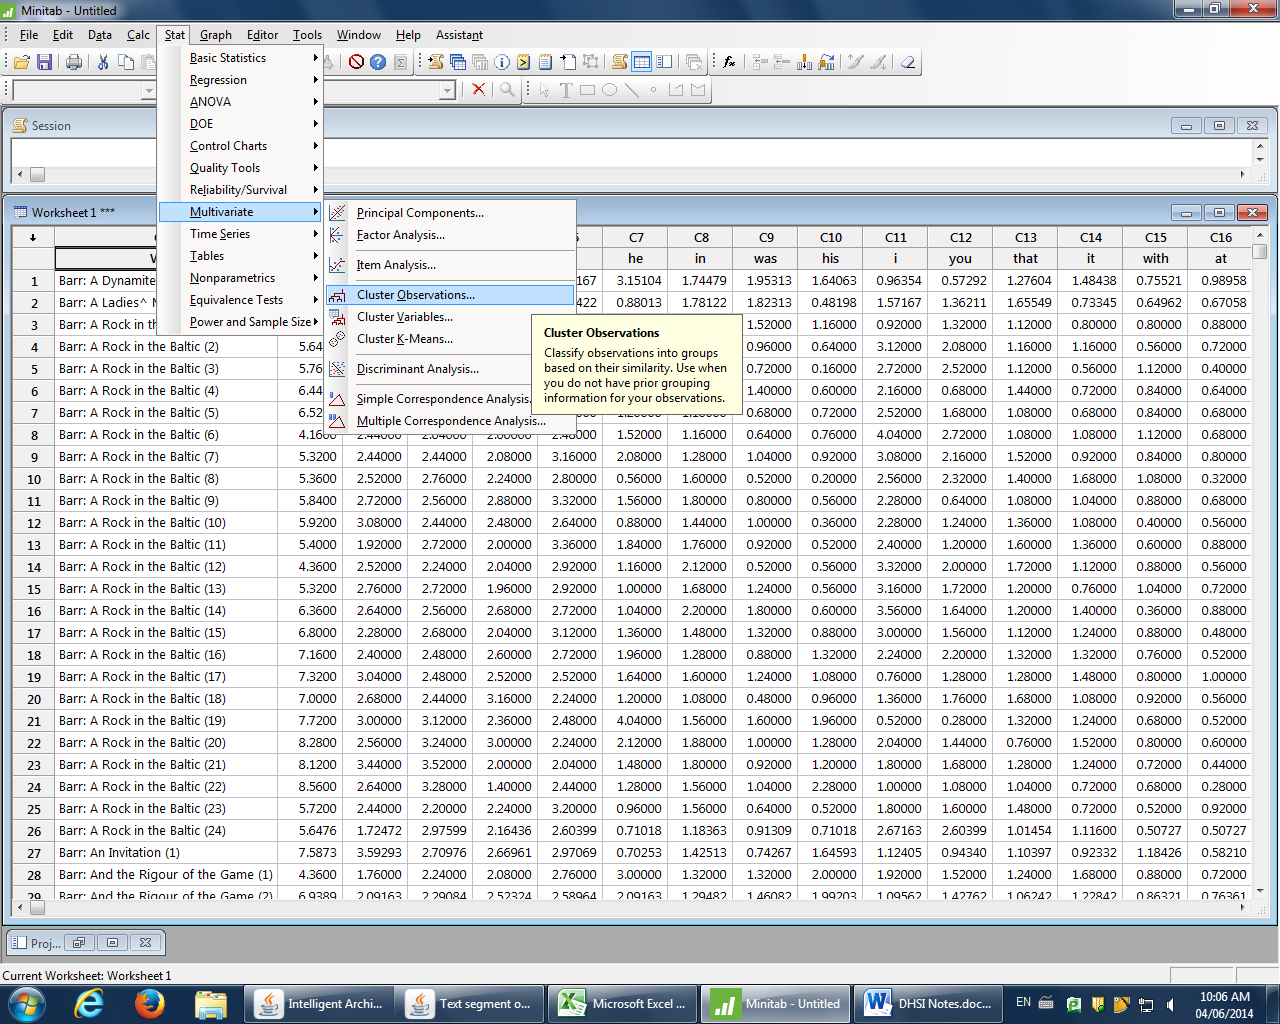
In this new Minitab worksheet, go to “Stat” in the toolbar, choose “Multivariate,” and then “Cluster Observations.”
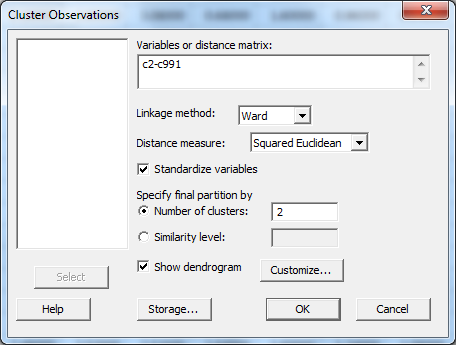
Under “Cluster Observations,” set the parameters to measure as many of the words as desired (words are listed down the left-hand side; these disappear once the range is selected). For example, c2-c991 captures the 1st to 990th most frequently used words. Select “Ward” as Linkage Method, “Squared Euclidean” as the Distance Measure, and click “Standardize Variables” and click “Show Dendrogram.” The cluster number should be appropriate to what is being compared; here, there are two authors being compared, so I’ve selected two major clusters.
Under “Customize,” give the dendrogram a title, and put in “word” as the case label. Here, the title indicates the measure of 990 most frequent words.
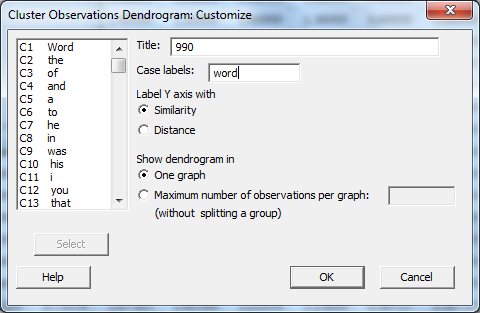
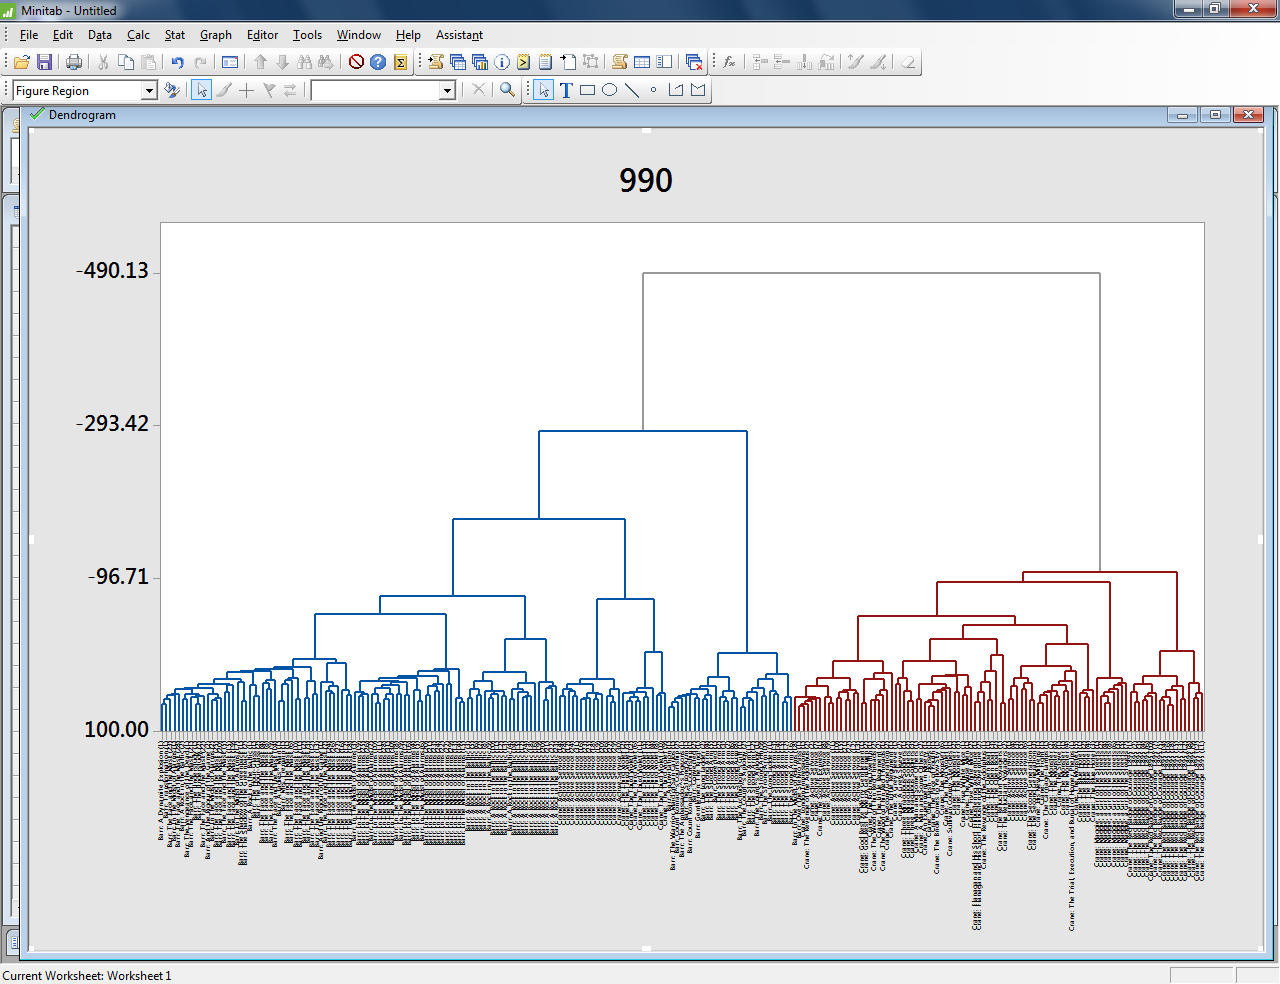
Click OK and OK again and the dendrogram appears. If desired, right-click on the titles along the bottom and go to “Edit X Scale” to make the font smaller, and change the alignment to 90 degrees for easier reading.
This dendrogram visualizes a comparison in which all the Barr texts group together in the blue cluster, while all the Crane texts groups together in the red cluster. This means that these two authors can be easily distinguished based on the most frequent 990 words they use.
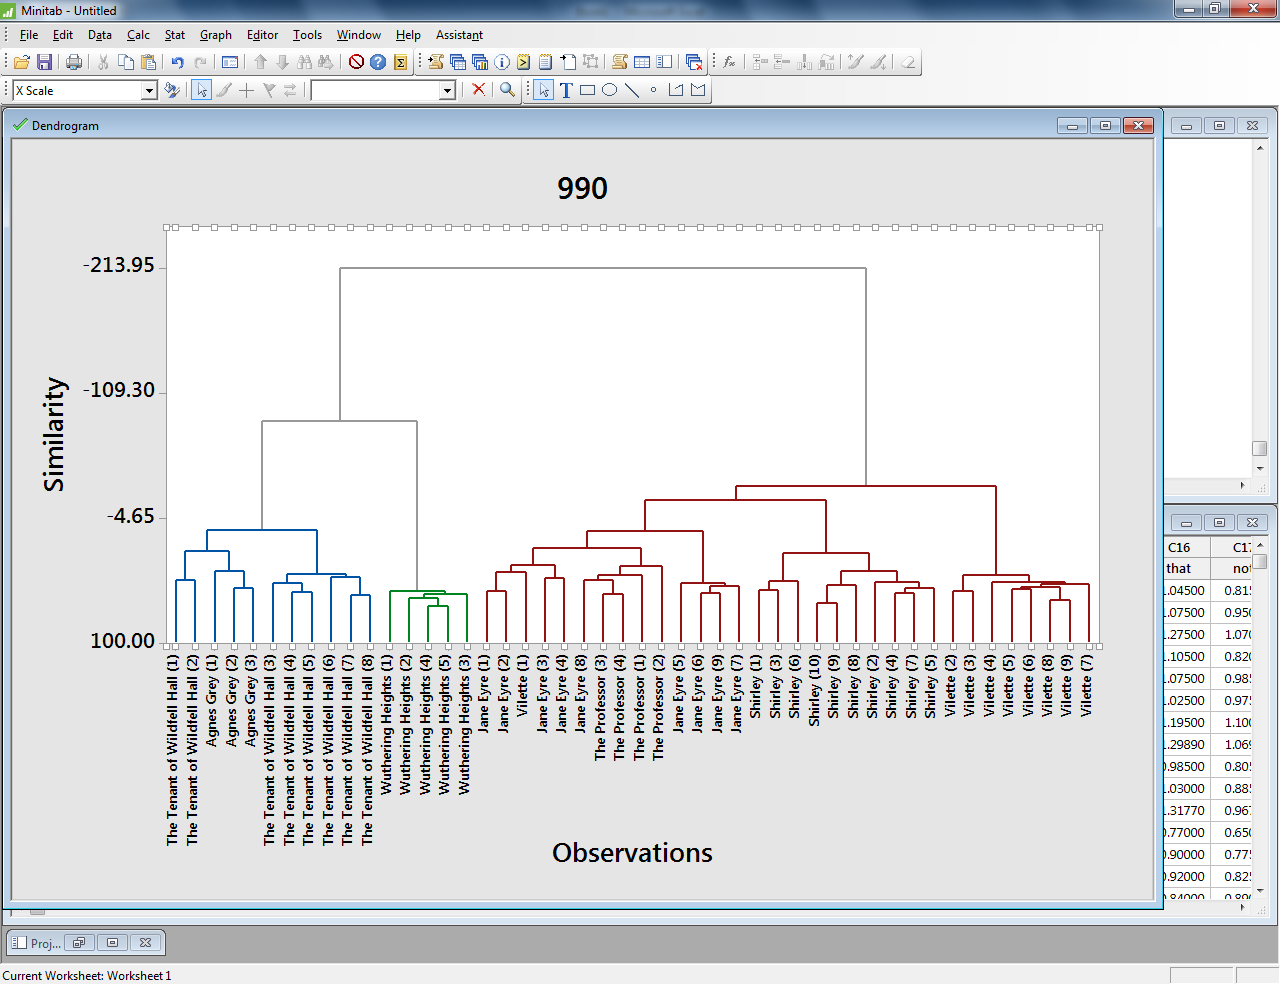
In this example, a similar analysis of a number of texts by the Bronte sisters reveals that certain parts of their novels group with one another stylistically. The beginnings of their novels are especially similar — often, beginning sections are more similar in terms of word choice to other beginning sections of other novels than they are to the rest of the same novel.
I also used this tool to measure the most frequently-used words in approximately 30 randomly-selected letters George Whalley wrote to his family between 1927 and 1956. In this case, I created a plain text file of all the letters, divided into individual letters using simple TEI headings. I indicated in the text set dialog that I want these divisions to be compared by selecting “Text Divisions” under Segmentation Method and inputting the division type (I only used one type of division to divide each letter, so I chose div1).

Then I followed the steps of changing the text segment display mode to proportions, selecting it all and copying to clipboard, pasting into Excel, transposing, replacing apostrophes with carats, and copying and pasting into Minitab. I used the usual parameters for Cluster Observations display.
The resulting Whalley dendrogram shows that a certain period of letter-writing is definable as using words differently than the others. These are a group of letters later in Whalley’s life (letters 24 to 29 of 31); however, the two letters that follow these are grouped with earlier letters (letter 30 is most closely aligned with letter 1, surprisingly, and letter 31 aligns most closely with letter 19).

I’m not quite sure what, if anything, to conclude from this visualization. It seems to me that this particular tool can be useful in indicating differences in style that need to be explored further through more traditional methods like close reading and research into historical context – for example, maybe a particular project Whalley was working on in the 1950s made its way into a number of letters. The dendrogram/word frequency analysis doesn’t show us this, but could point us towards it (if we didn’t already recognize it through reading the letters).
I would most recommend a tool like this for exploring authorship attribution or for very preliminary exploration of how certain topical keywords are used across a body of work. David Hoover is extremely well-read and a wonderful instructor, and I would also recommend his class to anyone interested in that kind of work.
Another DHSI, another tool learned!